Presentations

Engineering reproducibility in the face of entropy
The world won’t let you RAP and what to do about it! How functional programming can help you to write Reproducible Analytical Pipelines (RAP).
DataConnect 2022 2022-09-28
Searching For Data, Not Just Datasets
We’ll introduce structural search engine that indexes individual statistical observations so that users can find them using natural language. For example, we can search for “imports of cars from Germany” without needing to know in advance to look for e.g. the “Overseas Trade Statistics - Combined Nomenclature” publication.
DataConnect 2022 2022-09-26
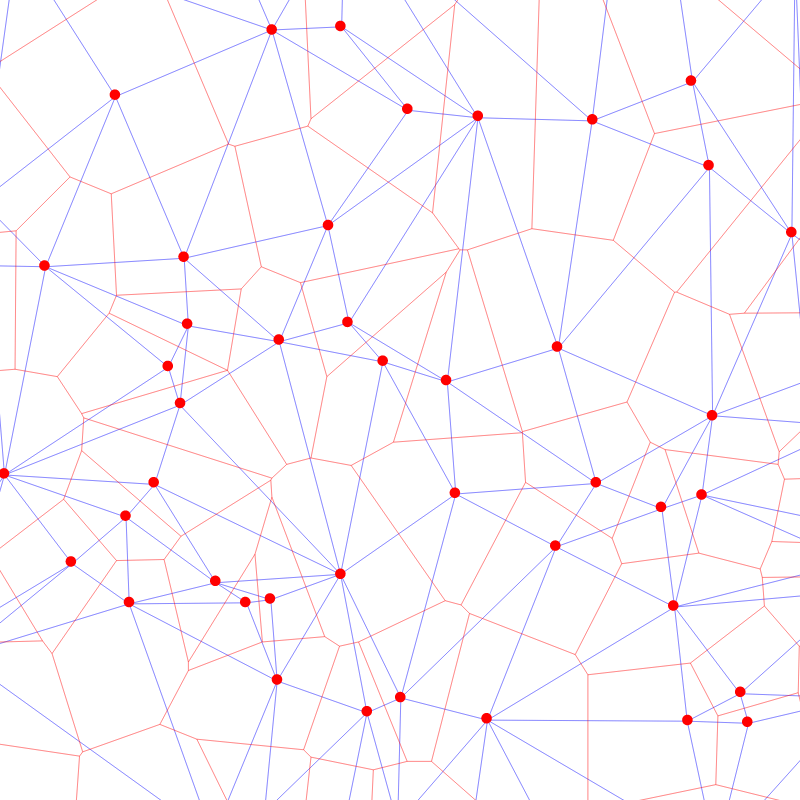
Linked-data Frames
Linked-data uses the Resource Description Framework (RDF) to identify resources with Uniform Resource Identifiers (URIs) and describe them with a set of statements, each specifying the value of a given property for the resource. These statements connect together to form a knowledge graph spanning the web.
The linked-data-frames package makes this data more amenable for idiomatic use in R by using the vctrs package to encapsulate resource descriptions.
We believe this is a novel use of vctrs to tabulate graphs. Learn about our practical experiences and the problems we encountered.
The package also helps users to download linked-data from the web, weaving together a variety of W3C standards and other linked-data vocabularies for working with statistical data cubes. The work was funded by the Integrated Data Programme, a cross-government initiative in the UK bringing together data from across the UK government and devolved administrations. This work to publish linked statistical open data in interoperable formats may also be of interest to R users.
UseR 2022 2022-06-23
Connecting Data From Different Sources
Lessons learned from the practical experience of publishing linked data with a variety of UK Government data owners. This talk demonstrates how identifiers can help to disambiguate resources and make data interoperable.
DataConnect 2022 2021-09-28
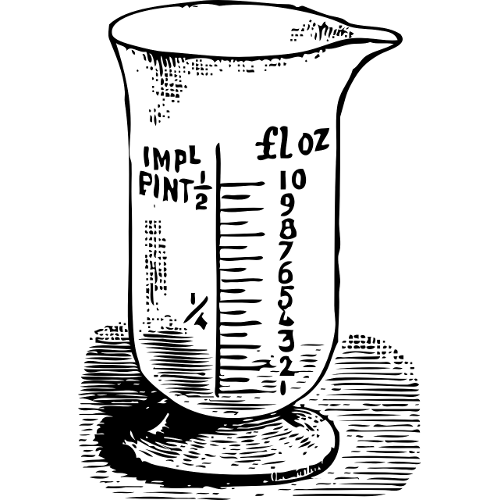
Taming Data with Science
Information Entropy is a way of measuring data in terms of the amount of uncertainty it resolves. We’ll use this perspective to explore techniques for structuring and analysing your data. You will learn practical ideas for how to extract more value from your data and leave with a framework for understanding the value proposition of data-driven products.
GOTO Nights Berlin 2019-09-24
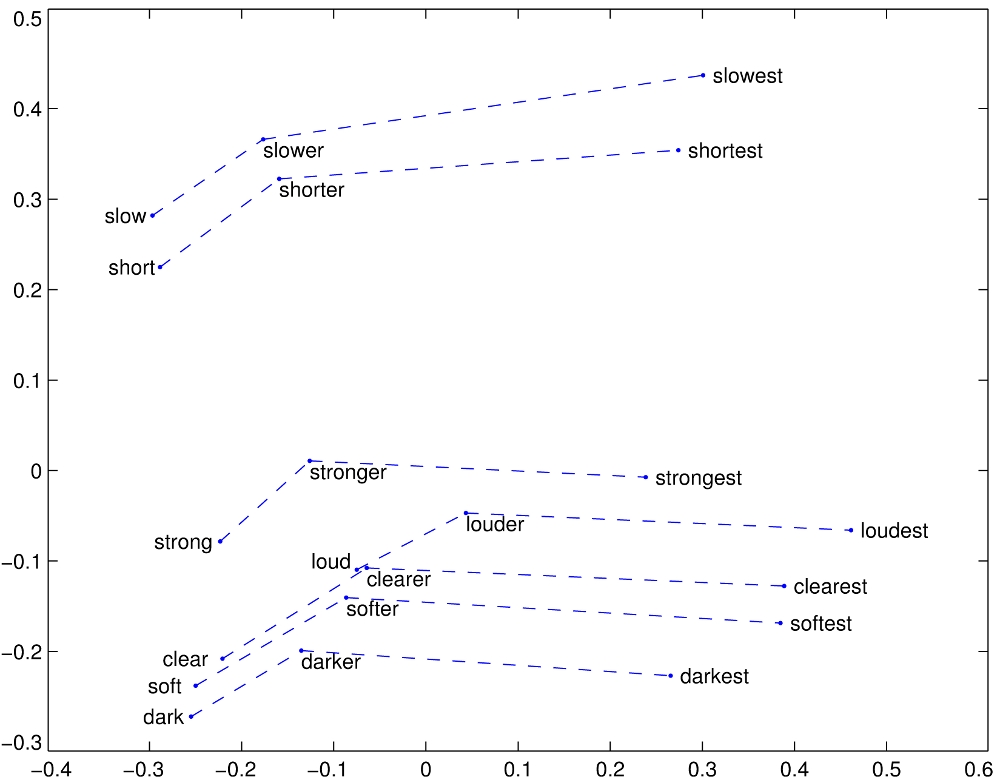
The Mechanical Poetry of Word Embeddings
How Word Embeddings let you do maths with language!
Chaos Computer Club Berlin Datengarten 2017-12-12

Calculate your Bus Factor - an introduction to GNU-R
The strength of open source comes from the community, but what would happen if some of it were to go missing?
Chaos Computer Club Berlin Datengarten 2017-05-09

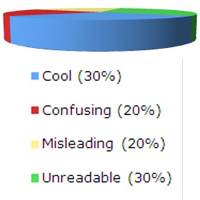
Stop Making Pie Charts!
An opinionated guide to the craft of data visualisation
Data Visualisation Berlin 2016-03-29
Open Data Manchester 2015-06-30

Improve your data
Lessons learned from the science of information entropy. I worked this up into a a blog post if you’d prefer a more thorough explanation.
Open Data Manchester 2014-05-27
The Split Apply Combine Strategy
A pattern for analysing data in subsets (i.e. for cross-tabulation) as demonstrated by the R package plyr.
Lambda Lounge 2015-08-17
Manchester R User Group 2015-08-24